Google Analytics metrics help track website performance and user behavior. Key metrics include sessions, pageviews, and bounce rate.
Understanding Google Analytics metrics is crucial for optimizing your website. Metrics such as sessions, pageviews, and bounce rate provide insights into how users interact with your site. Sessions indicate the total visits, while pageviews show the number of pages viewed.
The bounce rate reveals the percentage of visitors who leave after viewing only one page. Analyzing these metrics helps identify areas for improvement, track marketing effectiveness, and enhance user experience. Effective use of Google Analytics can lead to better decision-making and improved website performance. Keep a close eye on these metrics to ensure your online presence meets its goals.
Introduction To Google Analytics
Google Analytics is a powerful tool for understanding your website’s performance. It helps track and analyze how visitors interact with your site. This information is vital for improving user experience and achieving your business goals.
Importance Of Web Analytics
Web analytics are essential for any website owner. They provide insights into user behavior and preferences. With web analytics, you can:
- Identify popular content
- Understand traffic sources
- Track conversion rates
- Optimize marketing strategies
Without web analytics, you are flying blind. You can’t make informed decisions about your website.
Overview Of Google Analytics
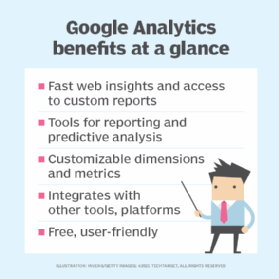
Google Analytics is a free web analytics service offered by Google. It tracks and reports website traffic. Here are some key features:
| Feature | Description |
|---|---|
| Real-Time Data | Monitor visitor activity as it happens. |
| Audience Reports | Analyze user demographics and interests. |
| Acquisition Reports | See where your traffic is coming from. |
| Behavior Reports | Understand how users interact with your site. |
| Conversion Tracking | Measure goal completions and e-commerce transactions. |
Google Analytics is easy to set up. You only need to add a tracking code to your website. Once installed, you can start collecting data immediately.

Credit: www.techtarget.com
Setting Up Google Analytics
Understanding how to set up Google Analytics is essential. This powerful tool helps track your website’s performance. Follow these steps to get started.
Creating An Account
First, you need to create a Google Analytics account. Visit the Google Analytics website and sign in with your Google account.
- Click on the Start for free button.
- Enter your account name. This name is for internal use.
- Choose your data sharing settings. Select the options that suit you.
- Click on the Next button to proceed.
Installing Tracking Code
After creating your account, you need to install the tracking code on your website. This code collects data and sends it to Google Analytics.
- Go to the Admin section in Google Analytics.
- Under the Property column, click on Tracking Info and then Tracking Code.
- Copy the Global Site Tag (gtag.js) code.
Paste the tracking code into your website’s HTML. Place it before the tag.
...
After pasting the code, save your changes. Now, Google Analytics will start tracking your website data.
Key Metrics To Track
Understanding Google Analytics metrics is crucial for tracking your website’s performance. Here, we’ll explain the key metrics you need to monitor. These metrics provide insights into user behavior, website efficiency, and overall effectiveness. Let’s dive into the essential metrics.
Users And Sessions
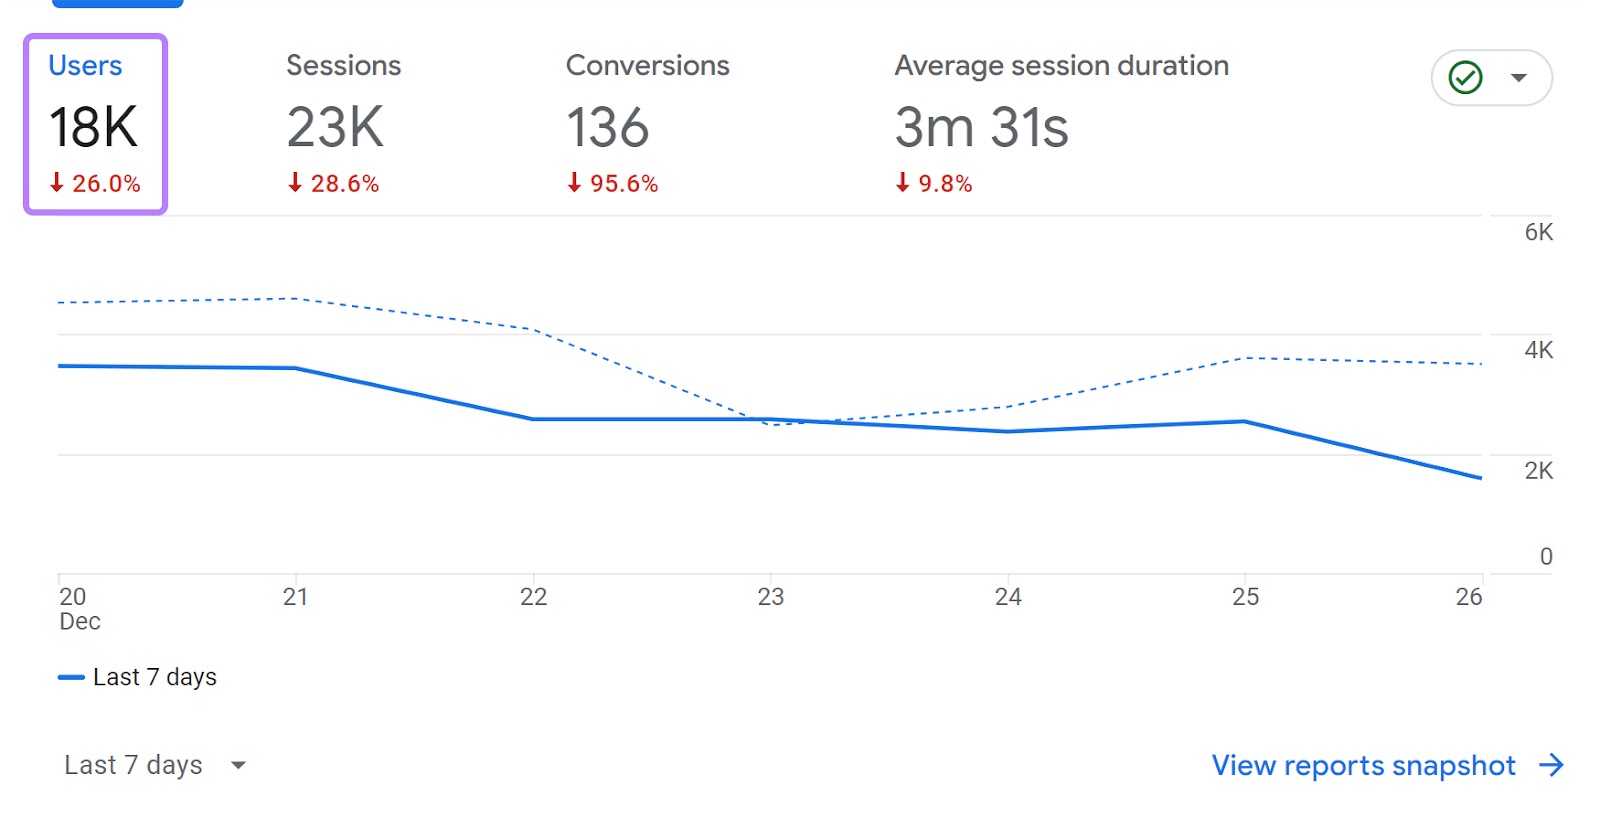
Users represent the unique visitors to your website. Each user is counted once, regardless of how many times they visit.
Sessions are the total number of visits. A session starts when a user arrives and ends when they leave or after 30 minutes of inactivity.
| Metric | Description |
|---|---|
| Users | Unique visitors to your site. |
| Sessions | Total visits, including repeated visits by the same user. |
Bounce Rate
The bounce rate is the percentage of visitors who leave after viewing only one page. A high bounce rate may indicate that your content isn’t engaging or relevant.
Reduce bounce rate by improving page content, navigation, and load time.
Average Session Duration
Average session duration measures the average time users spend on your site. Longer sessions typically indicate more engaging content and user satisfaction.
- Engage users with compelling content.
- Ensure easy navigation.
- Optimize page load speed.
Pageviews
Pageviews count the total number of pages viewed. Repeated views of a single page are also counted.
Track pageviews to understand which content attracts the most attention. High pageviews can mean popular and engaging content.
- Produce high-quality, relevant content.
- Promote popular pages.
- Monitor trends and adjust strategies.
Understanding Traffic Sources
Understanding traffic sources is vital for your website’s success. Google Analytics helps track where visitors come from. Let’s break down the main traffic sources: Direct Traffic, Referral Traffic, Organic Search, and Paid Search.
Direct Traffic
Direct traffic refers to visitors who type your URL directly. These users know your site and visit it intentionally. This traffic can also come from saved bookmarks or links in emails. Direct traffic often indicates a loyal audience.
Referral Traffic
Referral traffic comes from other websites that link to you. These visitors click on a hyperlink on another site to reach yours. This type of traffic helps build backlinks, which improve SEO. Tracking referral traffic shows which sites drive visitors to you.
Organic Search
Organic search traffic is from search engines like Google. Users find your site through unpaid search results. This traffic is crucial for long-term growth. Good SEO practices can increase your organic search traffic. Keywords, content quality, and backlinks play a role here.
Paid Search
Paid search traffic comes from ads on search engines. These are pay-per-click (PPC) campaigns. You pay for each click that leads to your site. Tracking paid search helps measure the ROI of your ad spend. It also reveals which keywords perform best.
| Traffic Source | Description | Benefits |
|---|---|---|
| Direct Traffic | Users who type your URL directly | Loyal audience |
| Referral Traffic | Visitors from other websites | Builds backlinks, improves SEO |
| Organic Search | Unpaid search engine results | Long-term growth, better SEO |
| Paid Search | Pay-per-click ads | Measures ad ROI, keyword performance |
Analyzing User Behavior
Understanding user behavior is key to improving your website. Google Analytics offers valuable metrics to help you analyze how users interact with your site. This section delves into three important aspects: Behavior Flow, Site Content Analysis, and Event Tracking.
Behavior Flow
The Behavior Flow report shows the path users take on your site. It helps you understand the journey from one page to another. This can reveal which pages keep users engaged and which don’t.
| Metric | Description |
|---|---|
| Landing Page | Where users first enter your site. |
| Drop-off | Where users leave the site. |
| Next Page Path | Where users go next. |
Analyze this data to improve user journeys. Identify high drop-off pages and optimize them.
Site Content Analysis
The Site Content Analysis report gives detailed insights into your site’s pages. You can see which pages get the most views, the average time spent, and more.
- Pageviews: Total views of a page.
- Unique Pageviews: Views from unique users.
- Average Time on Page: How long users stay on a page.
- Bounce Rate: Percentage of users who leave after viewing one page.
Use this data to understand which content performs best. Focus on creating similar high-performing content.
Event Tracking
Event Tracking lets you track specific actions users take. Actions like button clicks, video plays, and form submissions can be tracked.
- Set up tracking for important actions.
- Analyze the data to see which actions are most common.
- Optimize your site based on these insights.
Tracking events helps you understand user interactions beyond just page views. It provides a deeper level of insight into user behavior.

Credit: www.semrush.com
Conversion Tracking
Conversion tracking is a crucial aspect of Google Analytics. It allows you to measure the success of your marketing efforts. By tracking conversions, you can see how users interact with your website. This helps in understanding which actions lead to sales or other valuable outcomes.
Setting Up Goals
Setting up goals in Google Analytics is essential. Goals help you track specific user actions. These actions can be form submissions, page views, or downloads.
- Navigate to your Google Analytics dashboard.
- Click on the “Admin” tab.
- Under the “View” column, select “Goals”.
- Click on “New Goal” and follow the setup wizard.
Make sure to define your goals clearly. This will ensure you track what matters most to your business.
E-commerce Tracking
E-commerce tracking provides insights into your sales performance. It helps you understand which products are selling well. This feature allows you to track transactions and revenue.
- Go to the “Admin” tab in Google Analytics.
- Under the “View” column, select “E-commerce Settings”.
- Enable “E-commerce” and “Enhanced E-commerce Reporting”.
- Implement the necessary tracking code on your website.
Use e-commerce tracking to optimize your product listings. This can lead to increased sales and revenue.
Multi-channel Funnels
Multi-channel funnels provide insights into the customer journey. They show how different channels contribute to conversions. This includes organic search, paid ads, and social media.
| Channel | Description |
|---|---|
| Organic Search | Visitors from search engines. |
| Paid Ads | Visitors from paid advertising. |
| Social Media | Visitors from social platforms. |
To access multi-channel funnels:
- Go to the “Conversions” section in Google Analytics.
- Select “Multi-Channel Funnels”.
- Explore the different reports available.
Understanding these channels helps you allocate your marketing budget effectively. This ensures maximum ROI.
Customizing Reports
Google Analytics offers a lot of data. Customizing reports can help you focus. You can create custom dashboards, set up alerts, and export data. This section explains these features.
Creating Custom Dashboards
Custom dashboards allow you to display key metrics in one view. You can choose from various widgets. These include:
- Pie charts
- Tables
- Maps
- Timeline graphs
To create a custom dashboard, follow these steps:
- Go to your Google Analytics account.
- Click on Customization in the left menu.
- Select Dashboards, then click on Create.
- Choose the layout and add widgets.
- Save your dashboard.
This helps you quickly access important data.
Setting Up Alerts
Alerts notify you of significant changes in your data. You can set up alerts to track specific metrics. For example:
- Sudden traffic drops
- Increased bounce rates
- Spikes in new users
To set up alerts, follow these steps:
- Go to your Google Analytics account.
- Click on Admin.
- Under the View column, select Custom Alerts.
- Click on New Alert.
- Define your alert conditions and save it.
Alerts keep you informed in real-time.
Exporting Data
Exporting data allows you to share reports easily. You can export data in various formats, such as:
- Excel
- CSV
To export data, follow these steps:
- Go to the report you want to export.
- Click on the Export button at the top.
- Select your preferred format.
- Download the file to your computer.
This feature helps you analyze data offline.
Advanced Features
Google Analytics offers a suite of advanced features that can transform your data insights. Utilizing these tools can elevate your understanding of user behavior and site performance.
Using Segments
Segments allow you to isolate and analyze specific subsets of your traffic. This helps in understanding user behavior better. For instance, you can create segments to view data from mobile users or from visitors who completed a purchase.
- Predefined Segments: These include common filters like new users or returning users.
- Custom Segments: Tailor these to your unique needs, like users from a specific country.
Integration With Other Tools
Google Analytics integrates seamlessly with other tools to enhance your data insights. This integration helps in getting a more comprehensive view of your marketing efforts.
| Tool | Benefit |
|---|---|
| Google Ads | Track ad performance and ROI. |
| Google Search Console | Analyze search queries and organic traffic. |
| Google Data Studio | Create detailed and customizable reports. |
Enhanced E-commerce
Enhanced E-commerce provides deeper insights into user purchase behavior. This feature tracks every step of the shopping journey.
- Product Impressions: See which products are viewed the most.
- Product Clicks: Track clicks on product links.
- Checkout Behavior: Understand the checkout process and where users drop off.
- Transactions: Monitor completed purchases and revenue.
These insights help in optimizing your e-commerce performance and increasing sales.
Improving Site Performance
Improving your site performance is essential for maintaining user engagement and boosting conversions. Google Analytics offers valuable metrics to help you identify areas for improvement. By understanding these metrics, you can make data-driven decisions to enhance your website’s performance.
Identifying Bottlenecks
Google Analytics helps in identifying bottlenecks in your website. These are the areas where users experience delays or issues. Look at the page load times to see which pages are slow. Use the Behavior Flow report to see where users drop off. This helps in pinpointing problematic pages.
Consider these metrics:
- Average Page Load Time
- Exit Rate
- Bounce Rate
A/b Testing
A/B testing is crucial for improving site performance. It involves comparing two versions of a page to see which performs better. Use Google Analytics to track the performance of each version. This helps in making informed decisions on which design or content works best.
Steps for A/B testing:
- Create two versions of a page
- Measure performance using Google Analytics
- Analyze the results
- Implement the better-performing version
Using Insights For Optimization
Google Analytics provides valuable insights for optimization. Use these insights to make data-driven decisions. Look at user behavior metrics like session duration and pages per session. These metrics help in understanding user engagement levels.
Here are some key insights to focus on:
| Metric | Purpose |
|---|---|
| Session Duration | Understand how long users stay on your site |
| Pages per Session | See how many pages users visit per session |
| Goal Conversion Rate | Measure how well your site achieves business goals |
Using these insights, you can optimize your site for better performance. This leads to higher user engagement and increased conversions.

Credit: www.ruleranalytics.com
Final Thoughts
Understanding Google Analytics metrics is crucial for website success. These metrics help you track and improve your site’s performance. Here, we’ll discuss the importance of ongoing monitoring and explore future trends in analytics.
Ongoing Monitoring
Regular monitoring of your Google Analytics metrics is essential. It helps you identify areas for improvement. Monitoring ensures your data is up-to-date and accurate. Here are some key points to consider:
- Check your data daily to spot trends.
- Set up automated reports for convenience.
- Use alerts to notify you of significant changes.
Regular checks help you react quickly to changes. This ensures your site stays optimized and effective.
Future Trends In Analytics
The world of analytics is always evolving. Staying updated with future trends can give you a competitive edge. Here are some trends to watch:
- Artificial Intelligence: AI will make data analysis faster.
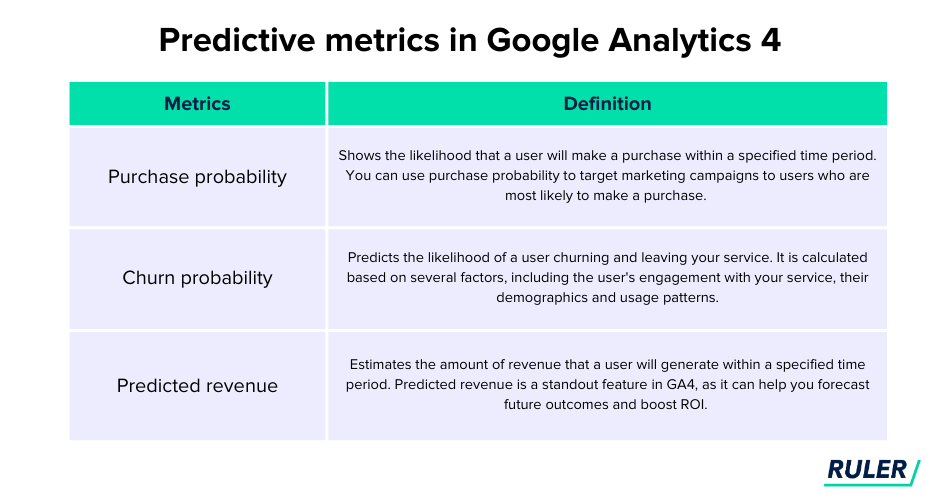
- Predictive Analytics: Predictive models will forecast future trends.
- Enhanced User Privacy: Stricter privacy laws will impact data collection.
These trends will shape how we use analytics. Adapting to these changes will keep your strategies relevant and effective.
Keeping an eye on these trends will help you stay ahead. Using the latest tools and methods will enhance your analytics strategy.
Conclusion
Understanding Google Analytics metrics is crucial for optimizing your website. These insights help improve user experience and boost conversions. Regularly monitor key metrics to stay ahead of trends. Use this data to make informed decisions and achieve your marketing goals.
Start leveraging Google Analytics today for greater online success.


